
Use RSI and ATR together by assigning each a different job: RSI describes recent price momentum, while ATR measures the size of price movements. Read both in the context of trend, price structure, timeframe, and events. Neither indicator establishes whether a trade will succeed.
What RSI tells you
The Relative Strength Index, or RSI, is a momentum oscillator on a scale of 0 to 100. A common setting uses 14 periods. Traditional reference levels are 70 for overbought and 30 for oversold, although interpretation depends on the market and settings.
Those labels are descriptions, rather than automatic instructions. RSI can remain elevated during a strong uptrend or depressed during a strong downtrend. A reading of 58 is not a 58% probability of a gain. Fidelity's RSI guide explains these limitations.
What ATR tells you
Average True Range, or ATR, measures volatility in the asset's price units. True range is the greatest of the current high minus low, the absolute high minus previous close, and the absolute low minus previous close. Averaging true range over a selected period incorporates gaps as well as intraperiod movement.
A 14-period ATR of $2 means the smoothed true range is $2 on that chart's timeframe. It is not a forecast that the next bar will move $2. ATR does not indicate direction. Rising volatility can accompany either a rally or a selloff. Fidelity's ATR guide describes its calculation and uses.
| Indicator | Measures | Does not establish |
|---|---|---|
| RSI | Recent momentum on a 0–100 scale | A guaranteed reversal or probability of profit |
| ATR | Smoothed true range in price units | Direction or a maximum possible loss |
How to use RSI and ATR together
- Choose a timeframe. Fourteen daily periods and fourteen five-minute periods describe very different windows.
- Read the price structure. Identify trend, range, nearby levels, and the event calendar before interpreting a number.
- Use RSI for momentum context. Ask whether recent momentum supports or conflicts with the proposed direction.
- Use ATR to understand movement size. Compare the proposed entry-to-invalidation distance with recent volatility. A volatility multiple is a planning convention, not proof that the level is appropriate.
- Check exposure and execution. Work out the planned loss, capital required, liquidity, and possible slippage. Waiting remains an available decision.
Annotated example: momentum, movement, and planned risk
This fictional 15-session series ends at $100 with an initial RSI(14) of 58 and ATR(14) of $2. The last 14 price changes total $5.80 of gains and $4.20 of losses. Each true range is $2. These numbers are constructed for education and are not a live market reading or a tested trading strategy.
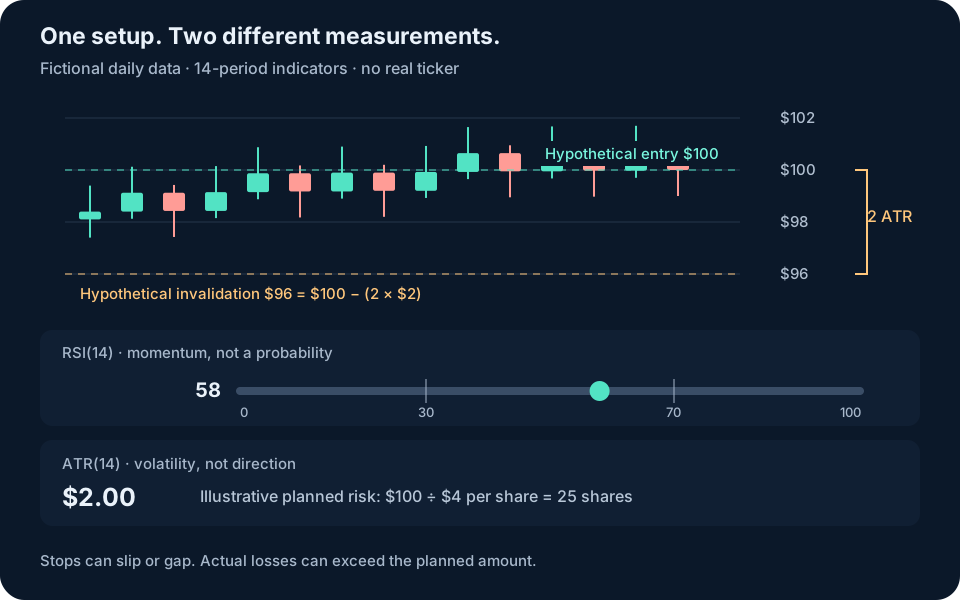
Assume, only for the calculation, an entry at $100 and an invalidation level of $96. The $4 distance equals twice the stated ATR. With a hypothetical $100 planned loss budget, $100 ÷ $4 = 25 shares. The position requires $2,500 before costs.
If volatility increases to $3 and the assumed distance remains two ATR, the distance becomes $6. The same arithmetic gives 16 whole shares after rounding down: a $96 planned loss and $1,600 of capital at a $100 entry. Your chosen level, portfolio limits, and execution conditions still need independent judgment.
Gaps, spreads, slippage, and order handling can produce a worse exit. Wider volatility does not justify taking more total risk, and no ATR multiple makes a trade safe.
Common mistakes when combining RSI and ATR
- Buying solely because RSI is below 30. Weak momentum can persist, especially in a downtrend.
- Treating high ATR as bullish. ATR measures movement size, not its direction.
- Mixing timeframes without a plan. A daily ATR and an intraday entry require an explicit holding-period rationale.
- Comparing dollar ATR across very different share prices. A $2 ATR has different relative scale on a $20 stock and a $200 stock.
- Optimizing settings on a small historical sample. An attractive past example may not generalize after trading costs or in a different market regime.
Use the indicators within a broader analysis
RSI and ATR are two views of historical price behavior. They do not tell you whether the company is fairly valued, whether new information will arrive, or whether a position fits your circumstances. Start with a stock research checklist when the business case is still unclear.
Sentinel adds a separate workflow for evaluating a proposed ticker and direction. Trade Filter returns an execution-quality score and reasoning; Market Timer returns timing context. The indicator example here is independent of Sentinel's scoring formula. Read the evidence and methodology to understand what its historical testing covers and what it does not.
Common questions
Is RSI or ATR better for trading?
They measure different things. RSI describes momentum; ATR measures volatility. Whether either helps depends on the question, timeframe, and tested process.
Does a high ATR mean a stock will rise?
No. ATR is not directional. It can rise during sharp price increases or decreases.
Is a two-ATR stop always appropriate?
No. Two ATR is an illustrative convention, not a universal rule. Price structure, timeframe, liquidity, events, and execution risks can make a different level—or no trade—more appropriate.
Sources & editorial note
Prepared by Sentinel with AI assistance and primary-source references. Examples are hypothetical unless stated otherwise. This guide is general education; it does not assess an individual investment or your circumstances. Read our editorial approach.